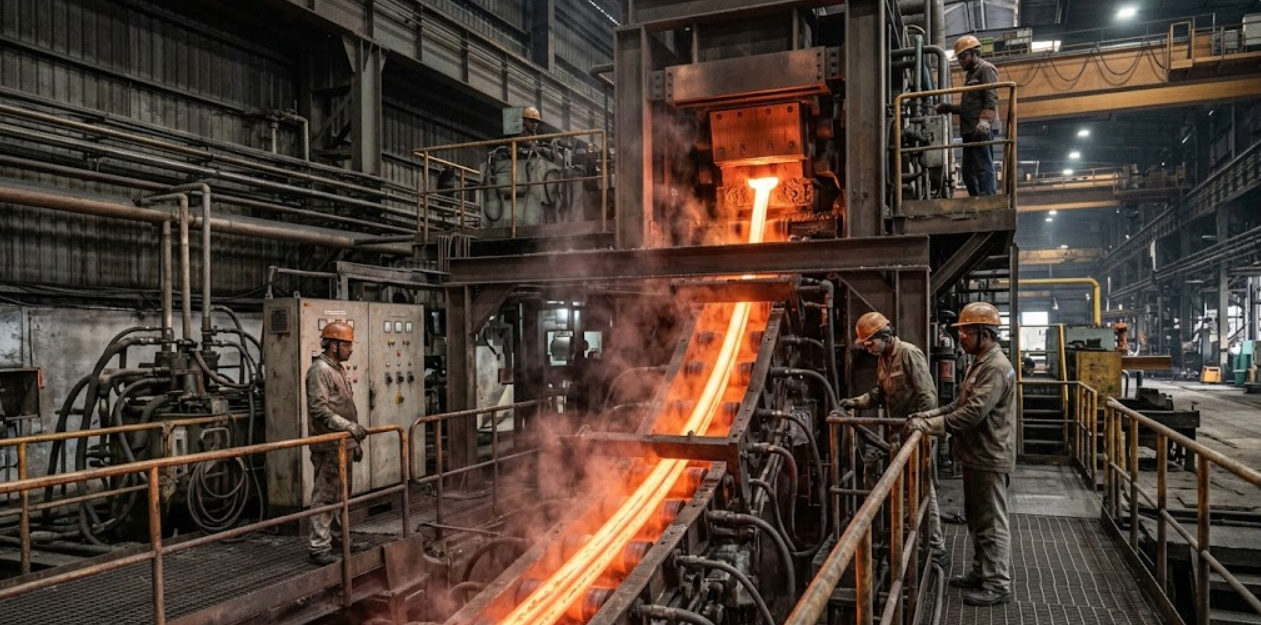
Loading...

MANUFACTURING

Building Future with Strength

Ambe Structures

MANUFACTURING

Ambe Structures Pvt. Ltd. is committed to delivering the highest quality structural steel solutions across India. With 18+ years of experience and state-of-the-art automated mills, we ensure precision and strength in every ton.

MANUFACTURING
Accreditations

Global Standards

BIS

Certified

ISO

Verified

Our Approach

Manufacturing Overview & Philosophy

Ambe Structures operates on world-class manufacturing principles combining lean methodologies, just-in-time production, and unwavering quality focus. Our customer-centric operations and continuous improvement culture drive excellence in every ton of steel produced.

Lean Manufacturing

Systematic elimination of waste through 5S, Kaizen, and value stream mapping. Continuous flow production minimizes inventory and maximizes efficiency across all operations.

Just-in-Time Approach

Synchronized production with demand to reduce inventory costs and improve cash flow. Pull-based system ensures optimal resource utilization and minimal waste generation.

Quality Focus

Quality built into every process stage through rigorous testing, statistical process control, and zero-defect mindset. First-pass yield of 99.3% demonstrates our quality commitment.

Customer-Centric Operations

Production planning aligned with customer requirements. Flexible manufacturing capabilities enable customization while maintaining efficiency and on-time delivery performance.

Continuous Improvement

Kaizen culture with 150+ employee suggestions implemented annually. Regular process audits and performance reviews drive incremental improvements across all manufacturing functions.

Sustainable Production

Environmentally responsible manufacturing with 85% scrap recycling, energy optimization, and zero-waste initiatives. Green manufacturing practices reduce environmental footprint.

Scale & Efficiency

Production Capacity & Utilization

With an annual production capacity of 250,000 TPA and current utilization of 85%, Ambe Structures operates at optimal efficiency levels. Strategic expansion plans target 300,000 TPA by 2026 to meet growing market demand.

250,000

TPA Capacity
Tonnes Per Annum

85%

Utilization
Current Operations

850

Tons/Day
Daily Production

3 Shifts

Operations
24/7 Production
Product Mix & Capacity Allocation
Angles 40% (100,000 TPA)
40%
Channels 35% (87,500 TPA)
35%
Beams 15% (37,500 TPA)
15%
Billets 10% (25,000 TPA)
10%
Expansion Plans

Target: 300,000 TPA by 2026 through additional rolling mill and furnace capacity. Investment: ?45 Crore.

Infrastructure

Manufacturing Units & Layout

State-of-the-art manufacturing facility spread across 15 acres with integrated production units. Optimized layout ensures smooth material flow from melting to finished goods storage.

Melting Shop
  • 2 Induction Furnaces
  • 15 Ton Capacity Each
  • 45-Min Tap-to-Tap Time
  • PLC Controlled Operations
Rolling Mill
  • 12-Stand Rolling Mill
  • Automated Control System
  • Size Range: 25mm-200mm
  • High Precision Tolerances
Finishing Section
  • Automated Cutting Lines
  • Hydraulic Bundling Press
  • Quality Inspection Bay
  • Marking & Labeling System
Warehouse
  • 5,000 MT Storage Capacity
  • Covered Storage Area
  • EOT Cranes: 10 Ton
  • Organized Inventory System
Facility Layout Highlights
  • Total Area: 15 acres integrated manufacturing complex
  • Built-up Area: 85,000 sq.ft covered production space
  • Material Flow: Linear layout for efficient material movement
  • Raw Material Yard: 3,000 MT scrap storage capacity
  • Quality Lab: 1,500 sq.ft testing facility with modern equipment
  • Utilities: Dedicated transformer, water treatment plant, compressed air
  • Loading Bay: 4 loading docks for simultaneous dispatch
  • Office Block: Administrative offices and control rooms
Operational Excellence

Production Planning & Scheduling

Advanced production planning system integrates demand forecasting, capacity planning, and material requirements to optimize manufacturing efficiency. Real-time scheduling ensures on-time delivery and resource optimization.

Planning Hierarchy
  • Demand Forecasting

    Monthly and quarterly demand analysis based on historical data, market trends, and customer orders. Accuracy: 92%

  • Production Scheduling

    Weekly production schedules optimized for product mix, changeover time, and delivery commitments. Rolling 4-week schedule

  • Material Planning (MRP)

    ERP-integrated MRP system ensures timely availability of raw materials. Automated purchase requisitions based on production plan

  • Capacity Planning

    Long-term capacity analysis identifies bottlenecks and expansion requirements. Utilization optimization across all equipment

  • Order Prioritization

    Dynamic order sequencing based on delivery dates, customer priority, and production efficiency. Critical orders fast-tracked

Planning Performance Metrics

92%

Forecast Accuracy

96%

On-Time Delivery

85%

Capacity Utilization

4 Weeks

Rolling Schedule

Digital Planning Tools
  • ERP System: SAP-based integrated planning and execution
  • APS Software: Advanced Planning & Scheduling for optimization
  • Real-Time Dashboards: Production monitoring and KPI tracking
  • Mobile Access: Production managers access schedules on mobile devices
Material Control

Inventory Management System

Sophisticated inventory management system optimizes working capital while ensuring material availability. Real-time tracking and ABC analysis enable efficient stock control across raw materials, WIP, and finished goods.

Raw Material Inventory
  • Stock Level: 15-20 days consumption maintained
  • Storage Capacity: 3,000 MT scrap yard with organized stacking
  • Quality Segregation: Grade-wise separation for quality control
  • FIFO System: First-in-first-out to prevent material aging
Current Stock 2,400 MT
WIP Tracking
  • Real-Time Monitoring: RFID-based tracking of material movement
  • Stage-wise Visibility: Melting, rolling, finishing stage tracking
  • Cycle Time Monitoring: Average cycle time: 6 hours from melt to finish
  • Quality Gates: Inspection checkpoints at each production stage
Avg WIP Value ?2.5 Cr
Finished Goods
  • Stock Level: 7-10 days sales inventory maintained
  • Storage: 5,000 MT covered warehouse with organized racks
  • Product-wise Segregation: Angles, channels, beams stored separately
  • Ready-to-Dispatch: Pre-bundled and labeled for quick loading
Current Stock 3,800 MT
Stock Optimization - ABC Analysis
Category A Items: High value, 20% items, 70% value

Premium scrap grades, high-demand finished products. Daily monitoring, tight control.

70% Value
Category B Items: Medium value, 30% items, 25% value

Standard scrap grades, regular products. Weekly monitoring, moderate control.

25% Value
Category C Items: Low value, 50% items, 5% value

Consumables, spares, low-value items. Monthly monitoring, basic control.

5% Value
ERP Integration
  • Real-Time Updates: Automatic inventory updates with every transaction
  • Barcode Scanning: Material receipt and issue through barcode system
  • Automated Reordering: Purchase requisitions generated at reorder points
  • Stock Reports: Daily stock statements, aging analysis, movement reports
  • Cycle Counting: Perpetual inventory system with monthly physical verification
Inventory Turnover Ratio

8.5x per annum

Equipment Reliability

Preventive Maintenance Program

Comprehensive preventive maintenance program ensures maximum equipment uptime and reliability. Systematic maintenance scheduling, spare parts management, and CMMS software have reduced breakdown downtime by 35%.

Maintenance Schedule
Frequency Activities Equipment
Daily Visual inspection, lubrication, cleaning All critical equipment
Weekly Detailed inspection, minor adjustments Furnaces, rolling mill
Monthly Component replacement, calibration Hydraulic systems, motors
Quarterly Major overhaul, predictive testing Furnace refractory, mill rolls
Maintenance Performance

35%

Downtime Reduction

96.5%

Equipment Uptime

?8 Lakh

Monthly Maintenance Budget

15

Maintenance Team Size

Maintenance Strategies
  • Breakdown Prevention: Proactive maintenance to prevent unplanned stoppages
  • Spare Parts Management: Critical spares inventory worth ?45 Lakh maintained
  • CMMS Software: Computerized maintenance management for scheduling and tracking
  • Predictive Maintenance: Vibration analysis, thermography for early fault detection
  • Skilled Technicians: 15-member maintenance team with specialized training
Sustainable Operations

Energy Management & Optimization

Strategic energy management program reduces power consumption to 550 kWh/ton through efficiency measures, renewable energy integration, and continuous optimization. 12% cost reduction achieved through systematic energy initiatives.

550

kWh/Ton

Specific power consumption. Industry average: 650 kWh/ton

11 MW

Solar Capacity

On-site solar plant supporting cleaner manufacturing operations

12%

Cost Reduction

Energy cost savings achieved through optimization measures

0.95

Power Factor

Maintained through APFC panels, avoiding penalty charges

Energy Efficiency Measures
  • Variable Frequency Drives (VFD)

    VFDs installed on all major motors for speed control and energy savings. 15% energy reduction in motor operations.

  • LED Lighting

    Complete plant lighting converted to LED. 60% reduction in lighting energy consumption.

  • Furnace Optimization

    Improved refractory lining, power factor correction, and optimal charging practices reduce furnace power consumption.

  • Compressed Air Optimization

    Leak detection and repair program. Energy-efficient compressors with heat recovery system.

  • Waste Heat Recovery

    Heat recovery from furnace flue gases for preheating scrap, improving thermal efficiency.

Renewable Energy Integration
  • 11 MW Solar Plant: Installed renewable capacity supporting on-site operations
  • Grid-Connected System: Net metering arrangement with state electricity board
  • Renewable Mix: Solar power contributes significantly to total energy requirement
  • Energy Transition: 11 MW solar plant aligned with our sustainability roadmap
Installed Solar Capacity 11 MW
Energy Monitoring System
  • Real-Time Monitoring: Energy meters at all major load centers
  • SCADA Integration: Centralized energy monitoring dashboard
  • Daily Reports: Department-wise energy consumption analysis
  • Benchmarking: kWh/ton tracking against targets and best practices
Circular Economy

Waste Management & Recycling

Comprehensive waste management program achieves 85% scrap recycling rate through systematic segregation, reuse initiatives, and zero-waste targets. Environmental compliance and slag utilization minimize landfill disposal.

85%

Scrap Reuse Rate

Zero Waste

Initiative Target
Waste Segregation Categories
  • Hazardous Waste: Used oil, batteries, chemical containers - authorized disposal
  • Metallic Scrap: Crop ends, rejected pieces - 100% recycled in furnace
  • Non-Hazardous: Paper, plastic, wood - segregated for recycling/disposal
  • Slag: Furnace slag utilized in road construction and cement industry
Recycling & Reuse Initiatives
Waste Type Quantity/Month Recycling Rate
Metallic Scrap 120 Tons 100%
Furnace Slag 80 Tons 95%
Used Oil 500 Liters 80%
Refractory Waste 15 Tons 70%
Environmental Compliance
  • Consent to Operate from Pollution Control Board
  • Hazardous waste authorization for storage and disposal
  • Annual environmental audit and compliance reporting
  • Tie-up with authorized recyclers for hazardous waste
  • Zero liquid discharge through water recycling system
Slag Utilization

Furnace slag, a by-product of steel melting, is processed and supplied to:

  • Road construction companies for base material
  • Cement manufacturers as raw material additive
  • Brick manufacturers for aggregate replacement
Performance Excellence

Production Metrics & KPIs

Data-driven manufacturing through comprehensive KPI monitoring. Real-time dashboards track OEE, cycle time, yield rate, and quality metrics enabling proactive management and continuous improvement.

78%

OEE (Overall Equipment Effectiveness)

Availability: 92% � Performance: 88% � Quality: 96% = 78% OEE. World-class target: 85%

45 Min

Cycle Time per Heat

Tap-to-tap time for 15-ton furnace heat. Includes melting, tapping, and charging operations.

92%

Yield Rate

Finished product output vs raw material input. 8% loss in slag, scale, and crop ends.

850

Tons/Day Productivity

Average daily production across 3 shifts. Peak capacity: 950 tons/day achieved.

Quality Metrics
First Pass Yield (FPY) 99.3%
99.3%

Products meeting specifications in first attempt without rework

Customer Rejection Rate 0.15%
0.15%

Products rejected by customers. Target: Below 0.2%

Internal Rejection Rate 0.7%
0.7%

Products rejected during internal quality checks

On-Time Delivery 96%
96%

Orders delivered within committed timeline

Operational Efficiency Metrics
Metric Current Target Status
Equipment Uptime 96.5% 95% ?
Capacity Utilization 85% 80% ?
Energy Consumption 550 kWh/ton 600 kWh/ton ?
Scrap Recycling 85% 80% ?
Inventory Turnover 8.5x 8x ?
Labor Productivity 3.4 tons/person 3 tons/person ?
Performance Recognition

Achieved "Best Performing Plant" award in 2023 for consistent KPI excellence across all parameters.

Operational Excellence

Lean Manufacturing Practices

Systematic implementation of lean methodologies eliminates waste, improves flow, and maximizes value. 5S, Kaizen, TPM, and value stream mapping drive continuous improvement across all operations.

5S Implementation
  • Sort (Seiri): Remove unnecessary items from workplace
  • Set in Order (Seiton): Organize and label everything
  • Shine (Seiso): Clean and inspect regularly
  • Standardize (Seiketsu): Create standards and procedures
  • Sustain (Shitsuke): Maintain discipline through audits
5S Audit Score 92%
Kaizen Culture

Continuous improvement through employee suggestions and small incremental changes. Every employee empowered to identify and implement improvements.

150+
Suggestions/Year
75%
Implementation Rate
  • Monthly Kaizen awards
  • Cross-functional improvement teams
  • Kaizen board in each department
Value Stream Mapping

Visual mapping of material and information flow identifies waste and improvement opportunities. Annual VSM exercises for all product families.

  • Current State Map: Document existing process flow
  • Future State Map: Design improved process
  • Implementation Plan: Action items with timelines
  • Results: 20% cycle time reduction achieved
Seven Wastes Elimination
Waste Type Examples Countermeasures
Overproduction Excess inventory Pull system, JIT
Waiting Idle time Line balancing
Transportation Material movement Layout optimization
Over-processing Unnecessary steps Process simplification
Inventory Excess stock Inventory reduction
Motion Unnecessary movement Ergonomic design
Defects Quality issues Poka-yoke, SPC
Total Productive Maintenance (TPM)

Proactive maintenance approach involving operators in equipment care. Eight TPM pillars implemented for maximum equipment effectiveness.

  • Autonomous Maintenance: Operators perform basic maintenance tasks
  • Planned Maintenance: Scheduled preventive maintenance program
  • Quality Maintenance: Defect-free production through equipment care
  • Focused Improvement: Cross-functional teams tackle chronic losses
  • Early Equipment Management: Design for maintainability
96.5%
Equipment Uptime
35%
Downtime Reduction
Human Capital

Workforce Excellence & Skills

Skilled workforce of 250 employees drives manufacturing excellence. Comprehensive training programs, multi-skilling initiatives, and performance management systems ensure continuous capability development and high productivity.

250

Total Employees
Production & Support

2,500+

Training Man-Hours
Annual Investment

60%

Multi-Skilled
Cross-Trained Staff

3.4

Tons/Person/Day
Labor Productivity
Training Programs
  • Technical Skills Training

    Equipment operation, quality control, maintenance procedures. Hands-on training with certification.

  • Safety Training

    Mandatory safety induction, refresher courses, emergency response drills. 3,500+ man-hours annually.

  • Quality Awareness

    Quality standards, inspection techniques, problem-solving methods. Zero-defect mindset development.

  • Soft Skills Development

    Communication, teamwork, leadership programs for supervisors and managers.

  • On-the-Job Training

    Structured OJT program for new employees with mentorship and skill assessment.

Workforce Statistics
180
Production Staff
40
Maintenance Team
20
Quality Personnel
10
Support Staff
Multi-Skilling Initiative

Systematic cross-training program enables workforce flexibility and operational resilience. 60% of production staff trained in multiple operations.

  • Skill Matrix: Competency mapping for all employees with skill levels
  • Training Plans: Individual development plans based on skill gaps
  • Certification: Internal certification after competency assessment
  • Benefits: Operational flexibility, reduced dependency, career growth
Performance Management

Structured performance management system aligns individual goals with organizational objectives. KPI-based evaluation with regular feedback and recognition.

  • KPI Setting: Department and individual KPIs cascaded from company goals
  • Monthly Reviews: Performance tracking and feedback sessions
  • Incentive System: Production incentives linked to productivity and quality
  • Recognition: Best performer awards, appreciation certificates, rewards
Digital Transformation

Manufacturing Technology & Automation

Advanced automation and digital technologies enhance manufacturing efficiency and quality. PLC systems, SCADA monitoring, and Industry 4.0 initiatives position us for future manufacturing excellence.

PLC Systems

Siemens PLC controls for furnace operations, rolling mill, and material handling. Automated process control ensures consistency and efficiency.

Siemens S7-1200
SCADA System

Real-time monitoring of all production parameters. Centralized control room with visual dashboards for process visibility and control.

24/7 Monitoring
Automation Level

40% automation achieved in material handling, quality inspection, and process control. Continuous automation enhancement ongoing.

40% Automated
Industry 4.0

Digital transformation roadmap includes IoT sensors, data analytics, and smart manufacturing initiatives for competitive advantage.

Roadmap 2025
Current Automation Systems
  • Furnace Automation

    PLC-controlled power regulation, temperature monitoring, automatic charging system. Optimal melting efficiency and energy consumption.

  • Rolling Mill Control

    Automated mill speed control, roll gap adjustment, and cooling system. Precise dimensional control and surface finish.

  • Automated Cutting

    CNC-controlled cutting lines with length measurement and automatic bundling. Reduced manual handling and improved accuracy.

  • Quality Inspection

    Automated dimensional measurement systems, ultrasonic testing equipment. Consistent quality verification and data logging.

  • Material Handling

    EOT cranes with semi-automated controls, conveyor systems for material movement. Reduced manual handling and safety improvement.

Future Technology Plans
  • Digital Twin Technology

    Virtual replica of production line for simulation, optimization, and predictive maintenance. Implementation planned by 2025.

  • AI/ML Integration

    Machine learning for quality prediction, process optimization, and demand forecasting. Pilot projects underway.

  • IoT Sensors

    Wireless sensor network for real-time equipment monitoring, predictive maintenance, and energy management.

  • Advanced Analytics

    Big data analytics platform for production optimization, quality improvement, and decision support systems.

  • Robotic Automation

    Collaborative robots for material handling, inspection, and packaging operations. Feasibility study in progress.

Technology Investment

?12 Cr

Automation Investment (Last 3 Years)

?8 Cr

Planned Investment (2024-26)

Industry 4.0 Ready

Digital transformation roadmap aligned with global standards

Connect With Us

Join our mission to build a stronger nation.

Contact Now